import pandas as pd
import numpy as np
import matplotlib.pyplot as plt
%matplotlib inline
The distribution of weights of medalists in gymnastics and in rowing in the 2016 Olympic games for a comparison between them
mens_rowing = pd.read_csv('../data/mens-rowing.csv')
mens_gymnastics = pd.read_csv('../data/mens_gymnastics.csv')mens_rowing.head()| Unnamed: 0 | ID | Name | Sex | Age | Height | Weight | Team | NOC | Games | Year | Season | City | Sport | Event | Medal | |
|---|---|---|---|---|---|---|---|---|---|---|---|---|---|---|---|---|
| 0 | 158 | 62 | Giovanni Abagnale | M | 21.0 | 198.0 | 90.0 | Italy | ITA | 2016 Summer | 2016 | Summer | Rio de Janeiro | Rowing | Rowing Men's Coxless Pairs | Bronze |
| 1 | 11648 | 6346 | Jrmie Azou | M | 27.0 | 178.0 | 71.0 | France | FRA | 2016 Summer | 2016 | Summer | Rio de Janeiro | Rowing | Rowing Men's Lightweight Double Sculls | Gold |
| 2 | 14871 | 8025 | Thomas Gabriel Jrmie Baroukh | M | 28.0 | 183.0 | 70.0 | France | FRA | 2016 Summer | 2016 | Summer | Rio de Janeiro | Rowing | Rowing Men's Lightweight Coxless Fours | Bronze |
| 3 | 15215 | 8214 | Jacob Jepsen Barse | M | 27.0 | 188.0 | 73.0 | Denmark | DEN | 2016 Summer | 2016 | Summer | Rio de Janeiro | Rowing | Rowing Men's Lightweight Coxless Fours | Silver |
| 4 | 18441 | 9764 | Alexander Belonogoff | M | 26.0 | 187.0 | 90.0 | Australia | AUS | 2016 Summer | 2016 | Summer | Rio de Janeiro | Rowing | Rowing Men's Quadruple Sculls | Silver |
mens_gymnastics.head()| Unnamed: 0 | ID | Name | Sex | Age | Height | Weight | Team | NOC | Games | Year | Season | City | Sport | Event | Medal | |
|---|---|---|---|---|---|---|---|---|---|---|---|---|---|---|---|---|
| 0 | 794 | 455 | Denis Mikhaylovich Ablyazin | M | 24.0 | 161.0 | 62.0 | Russia | RUS | 2016 Summer | 2016 | Summer | Rio de Janeiro | Gymnastics | Gymnastics Men's Team All-Around | Silver |
| 1 | 796 | 455 | Denis Mikhaylovich Ablyazin | M | 24.0 | 161.0 | 62.0 | Russia | RUS | 2016 Summer | 2016 | Summer | Rio de Janeiro | Gymnastics | Gymnastics Men's Horse Vault | Silver |
| 2 | 797 | 455 | Denis Mikhaylovich Ablyazin | M | 24.0 | 161.0 | 62.0 | Russia | RUS | 2016 Summer | 2016 | Summer | Rio de Janeiro | Gymnastics | Gymnastics Men's Rings | Bronze |
| 3 | 18577 | 9829 | David Sagitovich Belyavsky | M | 24.0 | 165.0 | 55.0 | Russia | RUS | 2016 Summer | 2016 | Summer | Rio de Janeiro | Gymnastics | Gymnastics Men's Team All-Around | Silver |
| 4 | 18579 | 9829 | David Sagitovich Belyavsky | M | 24.0 | 165.0 | 55.0 | Russia | RUS | 2016 Summer | 2016 | Summer | Rio de Janeiro | Gymnastics | Gymnastics Men's Parallel Bars | Bronze |
fig, ax = plt.subplots()
ax.hist(mens_rowing.Weight, histtype='step', bins=5, label='Rowing')
ax.hist(mens_gymnastics.Weight, histtype='step', bins=5, label='Gymnastics')
ax.set_xlabel('Weight (kg)')
ax.set_ylabel('# of observations')
ax.legend()
plt.show()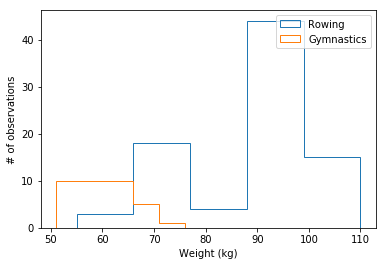
Selecting groups from the Summer 2016 Olympic Games medalist dataset to compare the height of medalist athletes in two different sports.
Adding error bars
fig, ax = plt.subplots()
ax.bar('Rowing', mens_rowing.Height.mean(), yerr=mens_rowing.Height.std())
ax.bar('Gymnastics', mens_gymnastics.Height.mean(), yerr=mens_gymnastics.Height.std())
ax.set_ylabel("Height (cm)")

plt.show()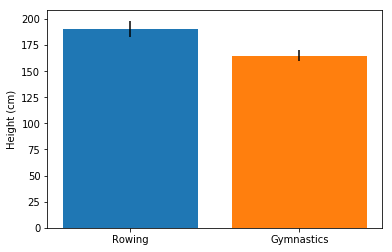
Boxplot
fig, ax = plt.subplots(figsize=(10,6))
ax.boxplot([mens_rowing.Height, mens_gymnastics.Height])
ax.set_xticklabels(['Rowing', 'Gymnastics'])
ax.set_ylabel('Height (cm)')
plt.show()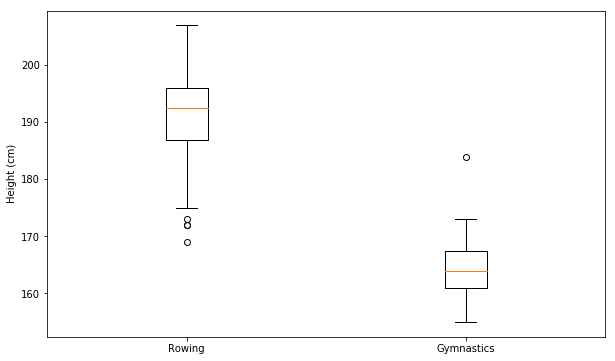
we can see how many individuals are outliers within their group.
summer_2016_medals = pd.read_csv('../data/summer_2016_medals.csv')
summer_2016_medals.head()| Unnamed: 0 | Name | Sex | Age | Height | Weight | Team | NOC | Games | Year | Season | City | Sport | Event | Medal | |
|---|---|---|---|---|---|---|---|---|---|---|---|---|---|---|---|
| 0 | 158 | Giovanni Abagnale | M | 21.0 | 198.0 | 90.0 | Italy | ITA | 2016 Summer | 2016 | Summer | Rio de Janeiro | Rowing | Rowing Men's Coxless Pairs | Bronze |
| 1 | 161 | Patimat Abakarova | F | 21.0 | 165.0 | 49.0 | Azerbaijan | AZE | 2016 Summer | 2016 | Summer | Rio de Janeiro | Taekwondo | Taekwondo Women's Flyweight | Bronze |
| 2 | 175 | Luc Abalo | M | 31.0 | 182.0 | 86.0 | France | FRA | 2016 Summer | 2016 | Summer | Rio de Janeiro | Handball | Handball Men's Handball | Silver |
| 3 | 450 | Saeid Morad Abdevali | M | 26.0 | 170.0 | 80.0 | Iran | IRI | 2016 Summer | 2016 | Summer | Rio de Janeiro | Wrestling | Wrestling Men's Middleweight, Greco-Roman | Bronze |
| 4 | 794 | Denis Mikhaylovich Ablyazin | M | 24.0 | 161.0 | 62.0 | Russia | RUS | 2016 Summer | 2016 | Summer | Rio de Janeiro | Gymnastics | Gymnastics Men's Team All-Around | Silver |
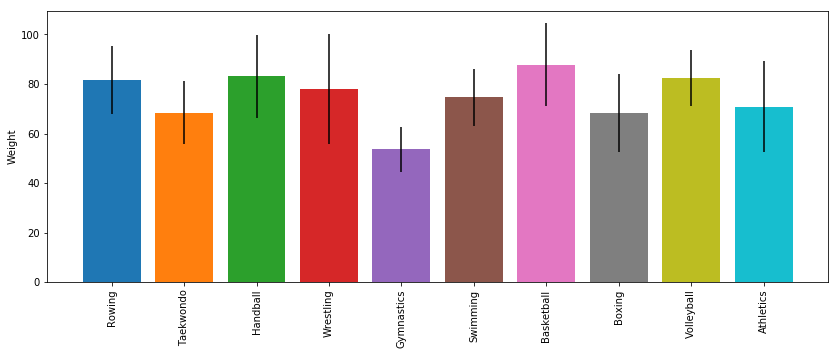
sports = summer_2016_medals.Sport.unique()
sports
array(['Rowing', 'Taekwondo', 'Handball', 'Wrestling', 'Gymnastics',
'Swimming', 'Basketball', 'Boxing', 'Volleyball', 'Athletics'],
dtype=object)fig, ax = plt.subplots(figsize=(14,5))
# Loop over the different sports branches
for sport in sports:
# Extract the rows only for this sport
sport_df = summer_2016_medals[summer_2016_medals['Sport']==sport]
# Add a bar for the "Weight" mean with std y error bar
ax.bar(sport,sport_df['Weight'].mean(), yerr=sport_df['Weight'].std())
ax.set_ylabel("Weight")
ax.set_xticklabels(sports, rotation=90)
# Save the figure to file
fig.savefig('../data/sports_weights.png')
plt.show()